Matplotlib
matplotlib 是python最著名的绘图库,它提供了一整套和matlab相似的命令API,十分适合交互式地行制图。而且也可以方便地将它作为绘图控件,嵌入GUI应用程序中。
优势
作为python上最有名气的绘图库:
快速绘图
matplotlib实际上是一套面向对象的绘图库,它所绘制的图表中的每个绘图元素,例如线条Line2D、文字Text、刻度等在内存中都有一个对象与之对应。
为了方便快速绘图matplotlib通过pyplot模块提供了一套和MATLAB类似的绘图API,将众多绘图对象所构成的复杂结构隐藏在这套API内部。我们只需要调用pyplot模块所提供的函数就可以实现快速绘图以及设置图表的各种细节。pyplot模块虽然用法简单,但不适合在较大的应用程序中使用。
为了将面向对象的绘图库包装成只使用函数的调用接口,pyplot模块的内部保存了当前图表以及当前子图等信息。当前的图表和子图可以使用plt.gcf()和plt.gca()获得,分别表示“Get Current Figure”和“Get Current Axes”。在pyplot模块中,许多函数都是对当前的Figure或Axes对象进行处理
plt.plot()实际上会通过plt.gca()获得当前的Axes对象ax,然后再调用ax.plot()方法实现真正的绘图
柱状图
横向
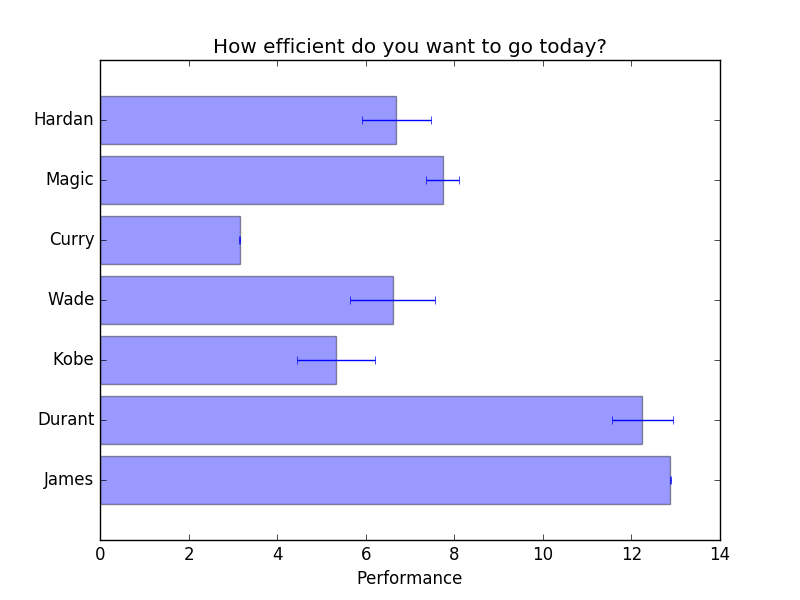
1 | import matplotlib.pyplot as plt |
纵向
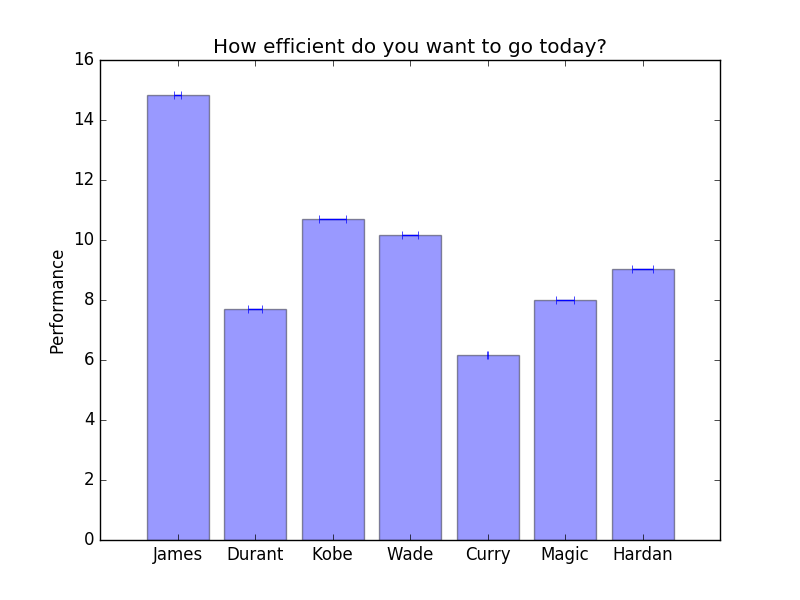
1 | people = ('James', 'Durant', 'Kobe', 'Wade', 'Curry','Magic','Hardan') |
解析
plt.rcdefaults()
恢复 rc 的默认设置
barh()
- 主要功能
:做一个横向条形图,横向条的矩形大小为: left, left + width, bottom, bottom + height
bar()
- 主要功能
:做一个纵向条形图,纵向条的矩形大小为: left, left + width, bottom, bottom + height
- 参数
:barh ( bottom , width , height =0.8, left =0, ** kwargs )
:bar ( bottom , width , height =0.8, left =0, ** kwargs )
- 返回类型
:一个 class 类别,matplotlib.patches.Rectangle实例
- 参数说明
:
bottom: Bars 的垂直位置的底部边缘width: Bars 的长度
- 可选参数:
height: bars 的高度
left: bars 左边缘 x 轴坐标值
color: bars 颜色
edgecolor: bars 边缘颜色
linewidth: bar 边缘宽度;None 表示默认宽度;0 表示不 i 绘制边缘
xerr: 若不为 None,将在 bar 图上生成 errobars
yerr: 若不为 None,将在 bar 图上生成 errobars
ecolor: 指定 errorbar 颜色
capsize: 指定 errorbar 的顶部(cap)长度
align:
edge(默认) |center:edge以底部为准对齐;center以 y 轴作为中心log: [False|True] False (默认),若为 True,使用 log 坐标
图形填充
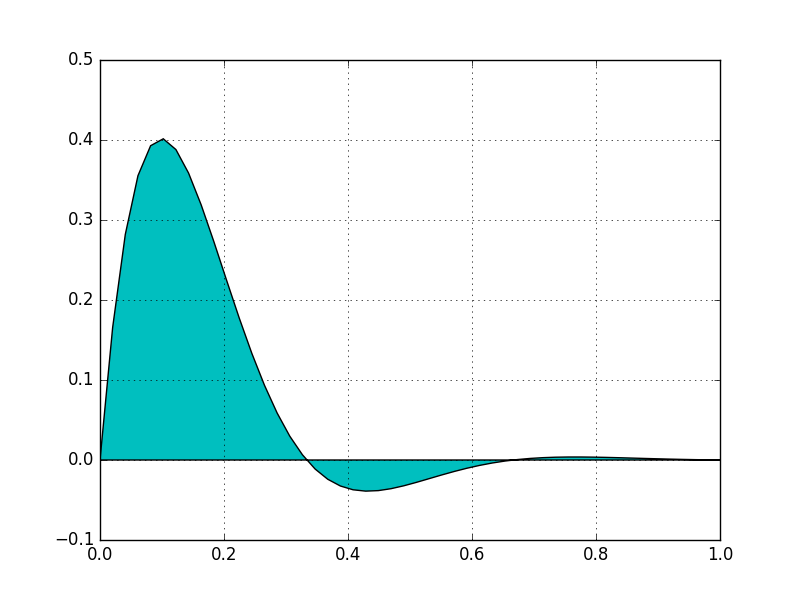
1 | import numpy as np |
Tip: grid 表示是否显示图轴网格。函数原型 matplotlib.pyplot.grid(b=None, which=’major’, axis=’both’, **kwargs)
- 调用形式:
grid(self, b=None, which=’major’, axis=’both’, **kwargs)
- 主要参数:
b: [True|False]或者是布尔数组、或[‘on’,‘off’] 表示网格是否开启
which: [major(默认)|minor|both] 选择主、次网格开启方式
axis: [both(默认)|x|y] 选择使用网格的数轴
1 | x = np.linspace(0, 3 * np.pi, 100) |
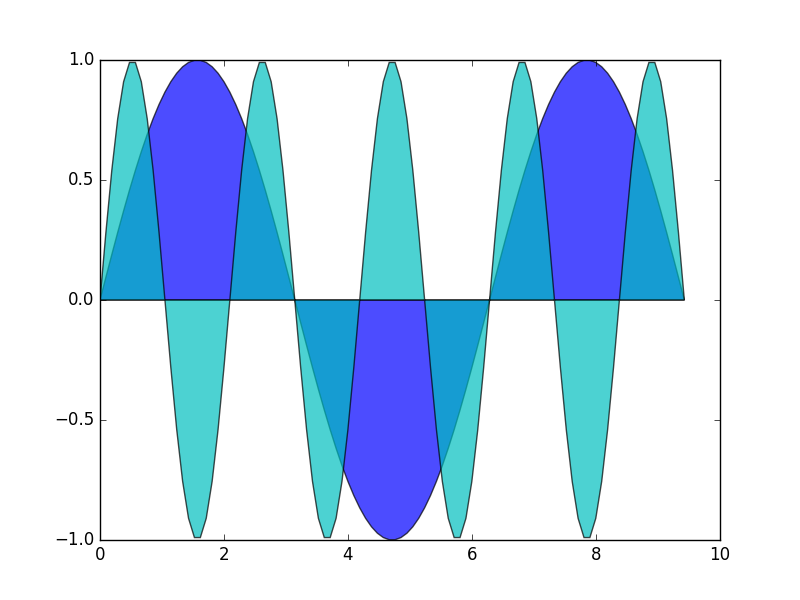
Tip:
alpha 表示透明度,0表示全透明,1表示完全不透明。